| Car | mfr | year | hp | hp_rpm | trq | trq_rpm | mpg_c | mpg_h |
|---|---|---|---|---|---|---|---|---|
| LaFerrari | Ferrari | 2015 | ||||||
| NSX | Acura | 2017 | ||||||
| GT-R | Nissan | 2016 | ||||||
| Aventador | Lamborghini | 2015 | ||||||
| Huracan | Lamborghini | 2015 | ||||||
| Gallardo | Lamborghini | 2014 | ||||||
| Continental GT | Bentley | 2016 | ||||||
| Granturismo | Maserati | 2016 | ||||||
| Quattroporte | Maserati | 2016 |
A Great Summer of Great Tables
My experience as a 2025 Posit Intern
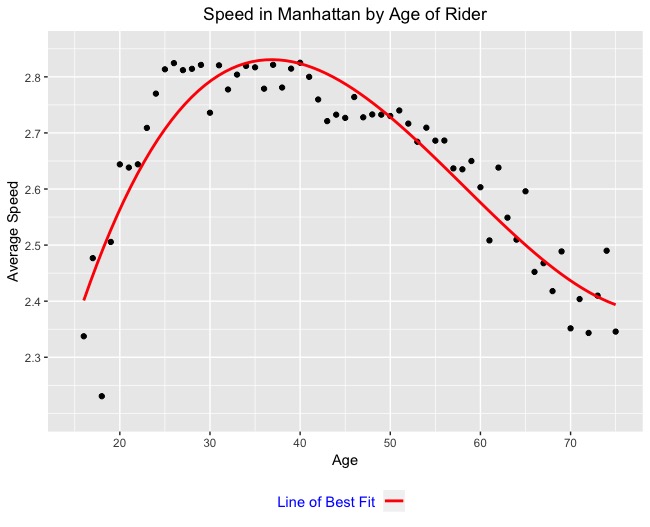
Who are you listening to
🐄 CS and Math at Williams College
🇪🇸 Taught English in Spain
💡 I enjoy patterns and helping people see patterns
🧗 I like to play table tennis, soccer, chess, and climb rocks
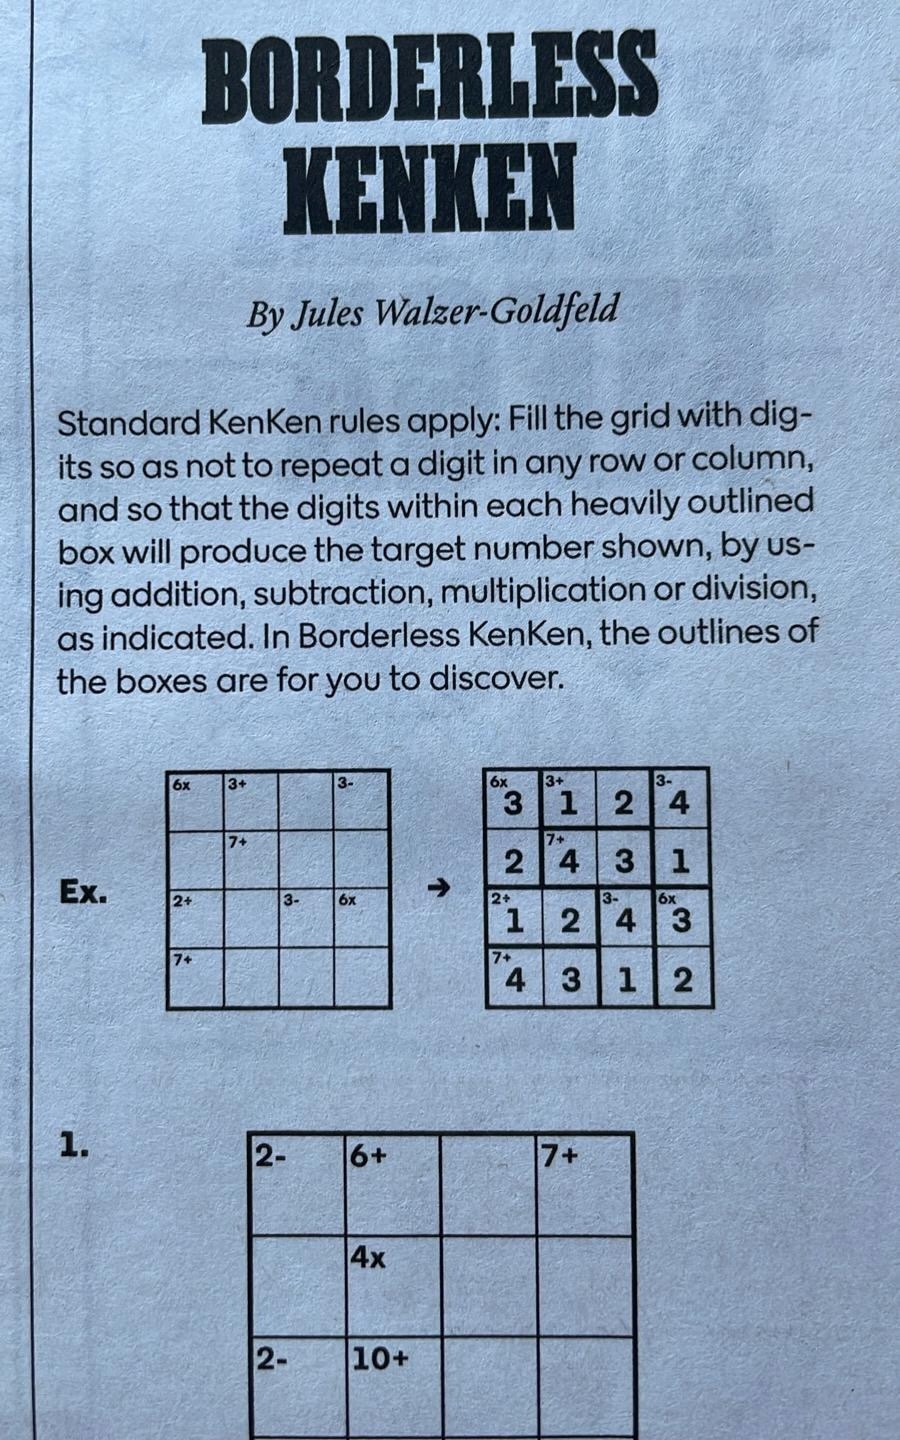
🔢 I like logic puzzles!
RStudio origin story

gt-extras
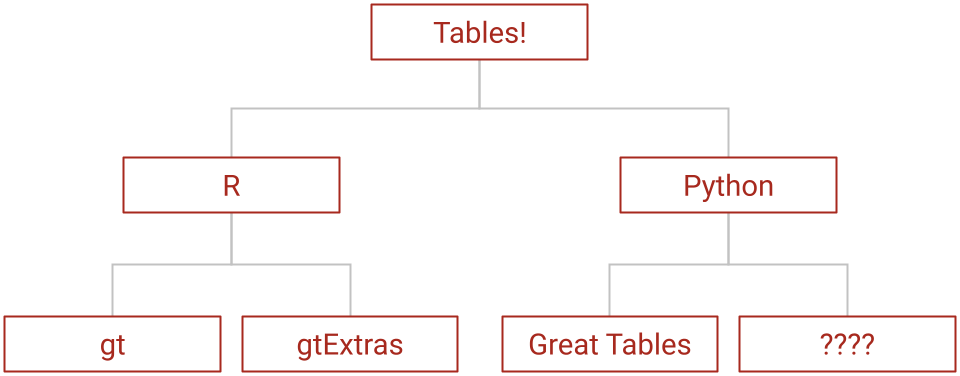
A Python port of Thomas Mock’s R package: {gtExtras}
gt-extras
gt-extras
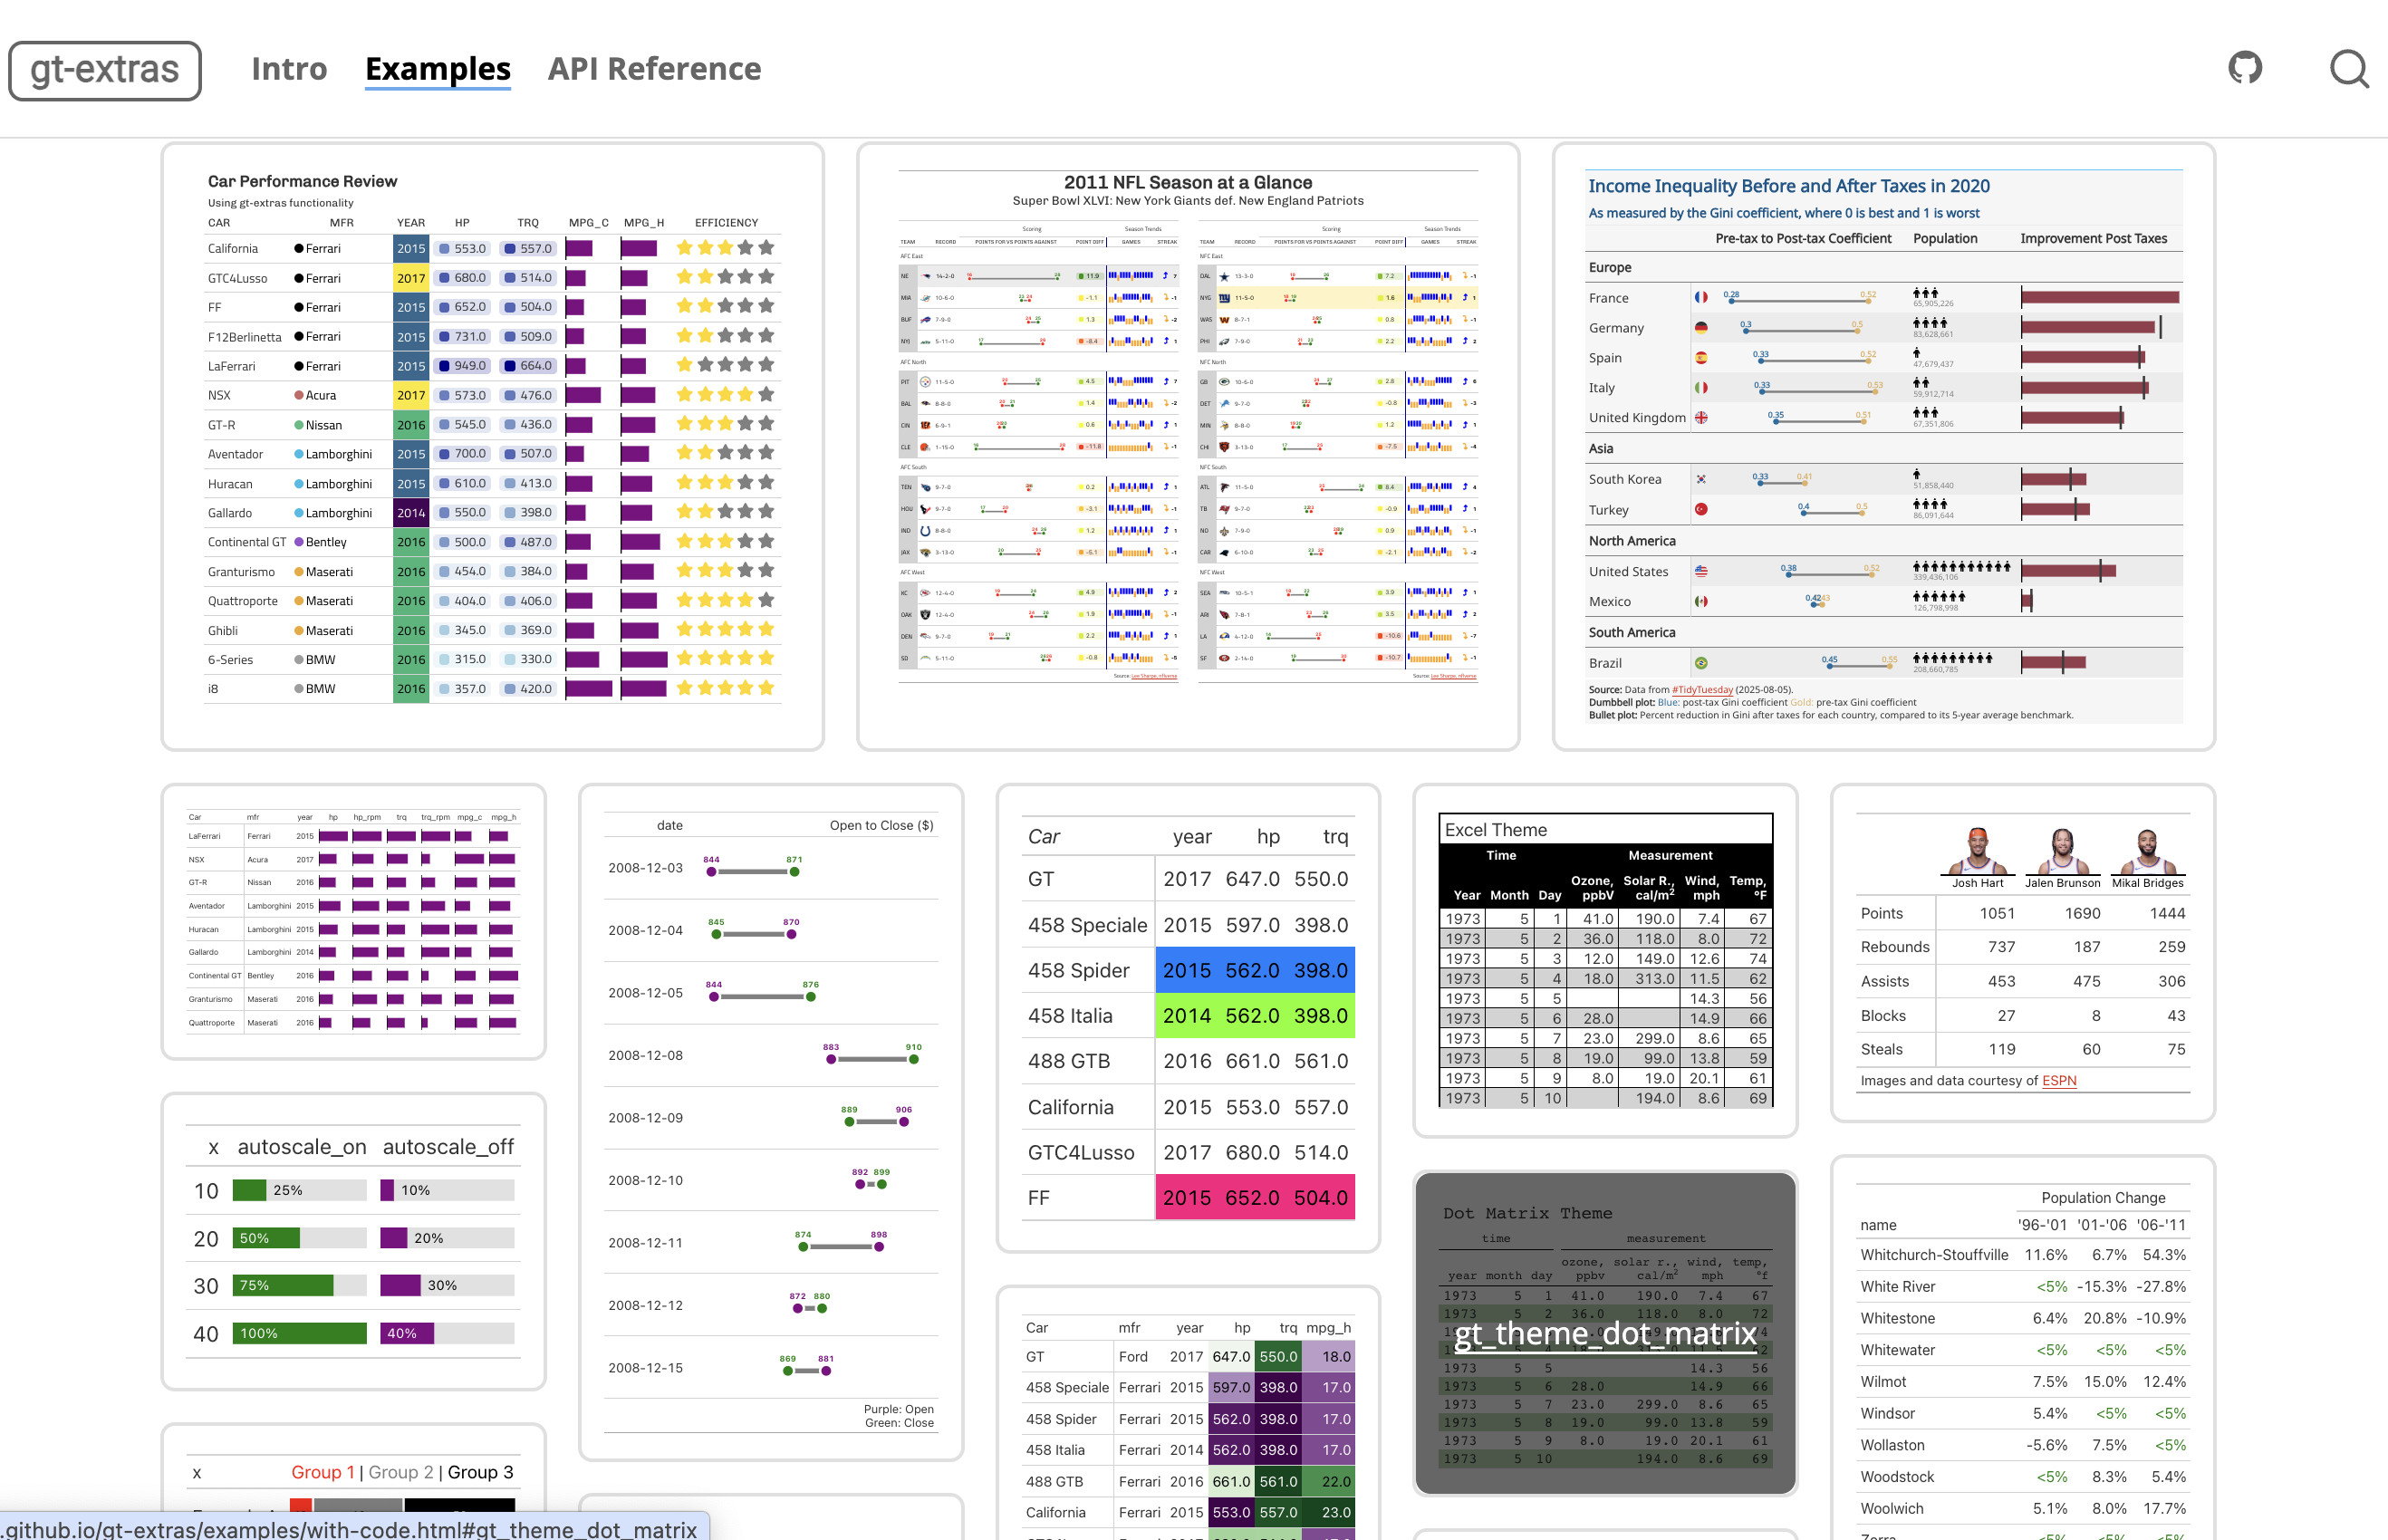
2011 NFL Season at a Glance
Super Bowl XLVI: New York Giants def. New England Patriots
| Team | Record | Scoring | Season Trends | |||
|---|---|---|---|---|---|---|
| Points For vs Points Against | Point Diff | Games | Streak | |||
| AFC East | ||||||
| NE |  |
14-2-0 |
28
16
|
11.9
|
7
|
|
| MIA |  |
10-6-0 |
23
24
|
-1.1
|
-1
|
|
| BUF |  |
7-9-0 |
25
24
|
1.3
|
-2
|
|
| NYJ |  |
5-11-0 |
17
26
|
-8.4
|
1
|
|
| AFC North | ||||||
| PIT |  |
11-5-0 |
25
20
|
4.5
|
7
|
|
| BAL |  |
8-8-0 |
21
20
|
1.4
|
-2
|
|
| CIN |  |
6-9-1 |
20
20
|
0.6
|
1
|
|
| CLE |  |
1-15-0 |
16
28
|
-11.8
|
-1
|
|
| AFC South | ||||||
| TEN |  |
9-7-0 |
24
24
|
0.2
|
1
|
|
| HOU |  |
9-7-0 |
17
20
|
-3.1
|
-1
|
|
| IND |  |
8-8-0 |
26
24
|
1.2
|
1
|
|
| JAX |  |
3-13-0 |
20
25
|
-5.1
|
-1
|
|
| AFC West | ||||||
| KC |  |
12-4-0 |
24
19
|
4.9
|
2
|
|
| OAK |  |
12-4-0 |
26
24
|
1.9
|
-1
|
|
| DEN |  |
9-7-0 |
21
19
|
2.2
|
1
|
|
| SD |  |
5-11-0 |
26
26
|
-0.8
|
-5
|
|
| Source: Lee Sharpe, nflverse | ||||||
| Team | Record | Scoring | Season Trends | |||
|---|---|---|---|---|---|---|
| Points For vs Points Against | Point Diff | Games | Streak | |||
| NFC East | ||||||
| DAL |  |
13-3-0 |
26
19
|
7.2
|
-1
|
|
| NYG |  |
11-5-0 |
19
18
|
1.6
|
1
|
|
| WAS |  |
8-7-1 |
25
24
|
0.8
|
-1
|
|
| PHI |  |
7-9-0 |
23
21
|
2.2
|
2
|
|
| NFC North | ||||||
| GB |  |
10-6-0 |
27
24
|
2.8
|
6
|
|
| DET |  |
9-7-0 |
22
22
|
-0.8
|
-3
|
|
| MIN |  |
8-8-0 |
20
19
|
1.2
|
1
|
|
| CHI |  |
3-13-0 |
17
25
|
-7.5
|
-4
|
|
| NFC South | ||||||
| ATL |  |
11-5-0 |
34
25
|
8.4
|
4
|
|
| TB |  |
9-7-0 |
22
23
|
-0.9
|
1
|
|
| NO |  |
7-9-0 |
29
28
|
0.9
|
-1
|
|
| CAR |  |
6-10-0 |
23
25
|
-2.1
|
-2
|
|
| NFC West | ||||||
| SEA |  |
10-5-1 |
22
18
|
3.9
|
1
|
|
| ARI |  |
7-8-1 |
26
23
|
3.5
|
2
|
|
| LA |  |
4-12-0 |
14
25
|
-10.6
|
-7
|
|
| SF |  |
2-14-0 |
19
30
|
-10.7
|
-1
|
|
| Source: Lee Sharpe, nflverse | ||||||
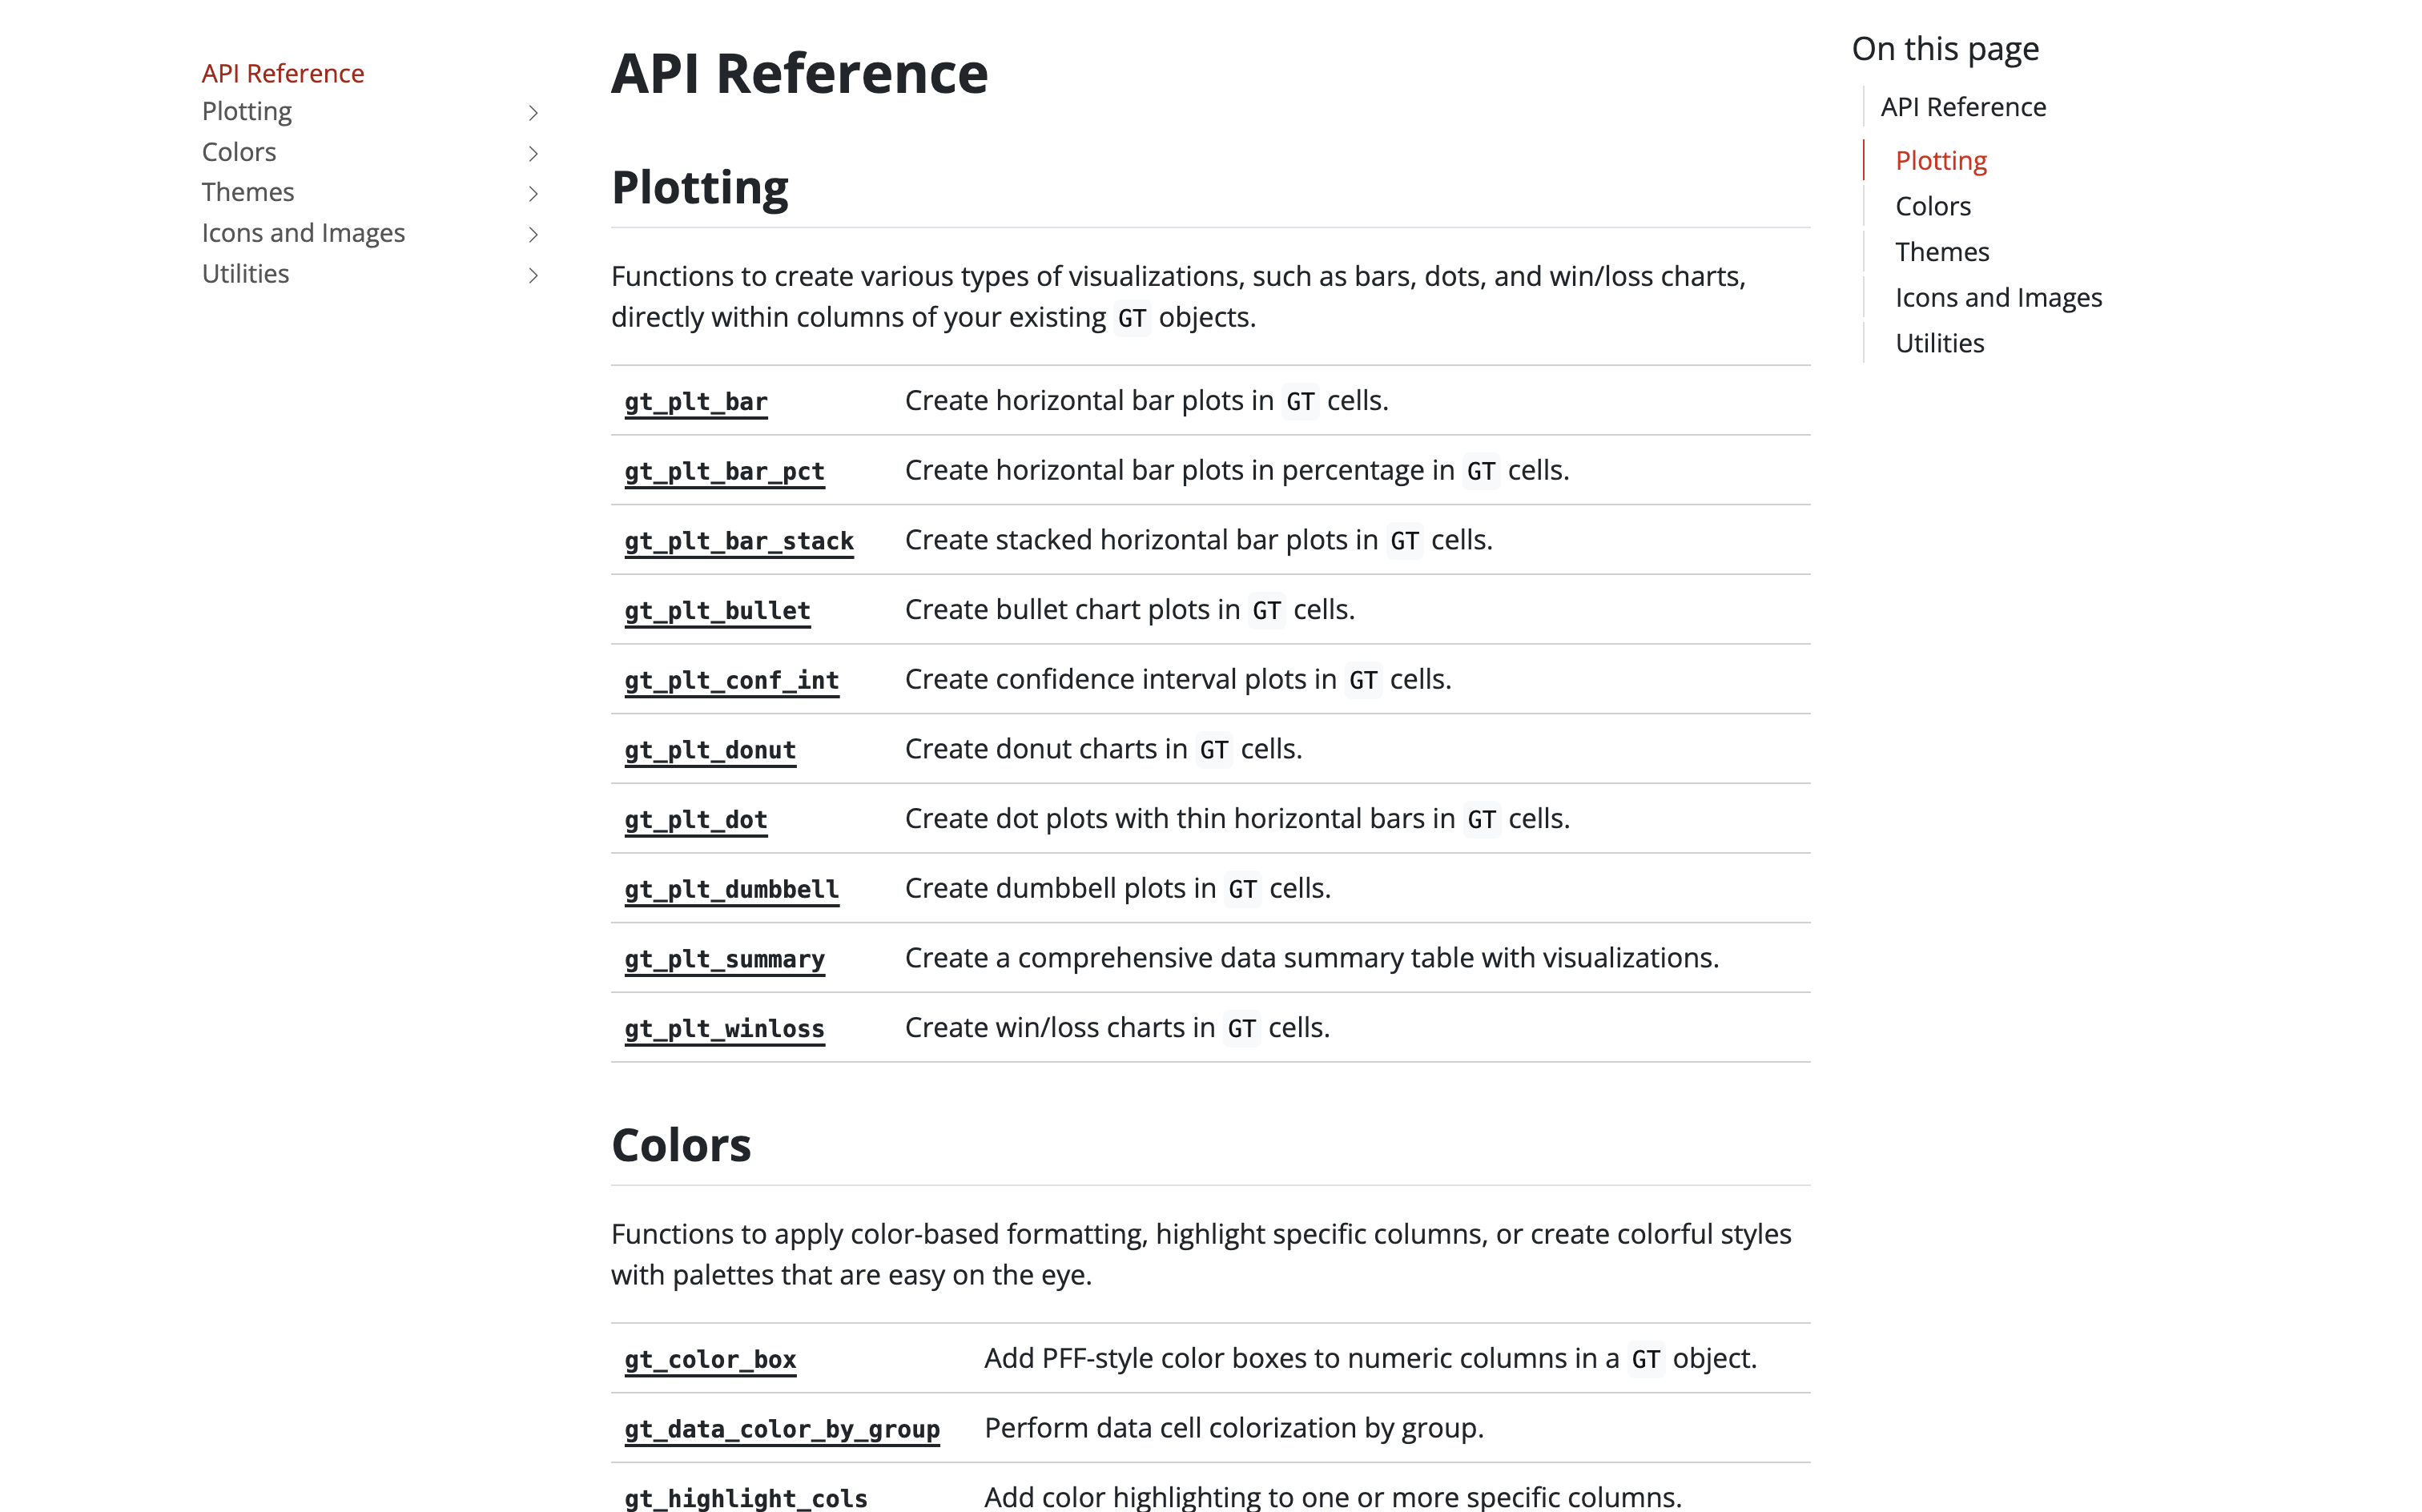
Plotting ➡️ gt_plt_summary()
| Summary Table | ||||||
| 45 rows x 5 cols | ||||||
| Type | Column | Plot Overview | Missing | Mean | Median | SD |
|---|---|---|---|---|---|---|
| Date | 0.0% | — | — | — | ||
| Value | 11.1% | 22.50 | 21.00 | 8.83 | ||
| Category | 22.2% | — | — | — | ||
| Boolean | 0.0% | 0.67 | — | — | ||
| Status | 33.3% | — | — | — | ||

Great Tables
Great Tables
A grand 😉 new feature
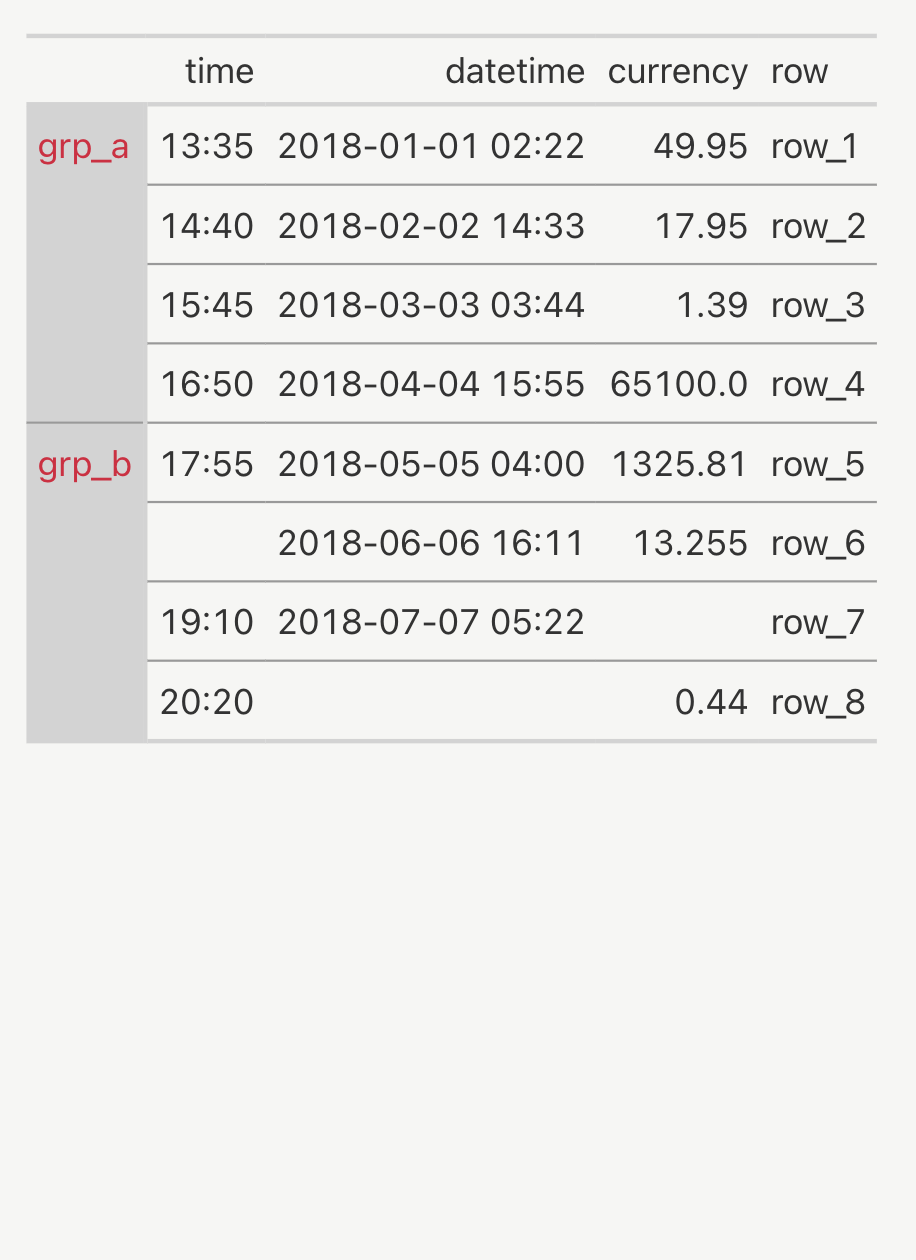
A row striping indexing fix with grouped data
A pair of improvements to autocoloring the text of striped rows

| Income Inequality Before and After Taxes in 2020 | ||||
| Pre-tax to Post-tax Coefficient | Population | Improvement Post Taxes | ||
|---|---|---|---|---|
| Europe | ||||
| France |
0.52
0.28
|
65,905,226
|
||
| Germany |
0.50
0.30
|
83,628,661
|
||
| Spain |
0.52
0.33
|
47,679,437
|
||
| Italy |
0.53
0.33
|
59,912,714
|
||
| United Kingdom |
0.51
0.35
|
67,351,806
|
||
| Asia | ||||
| South Korea |
0.41
0.33
|
51,858,440
|
||
| Turkey |
0.50
0.40
|
86,091,644
|
||
| North America | ||||
| United States |
0.52
0.38
|
339,436,106
|
||
| Mexico |
0.43
0.42
|
126,798,998
|
||
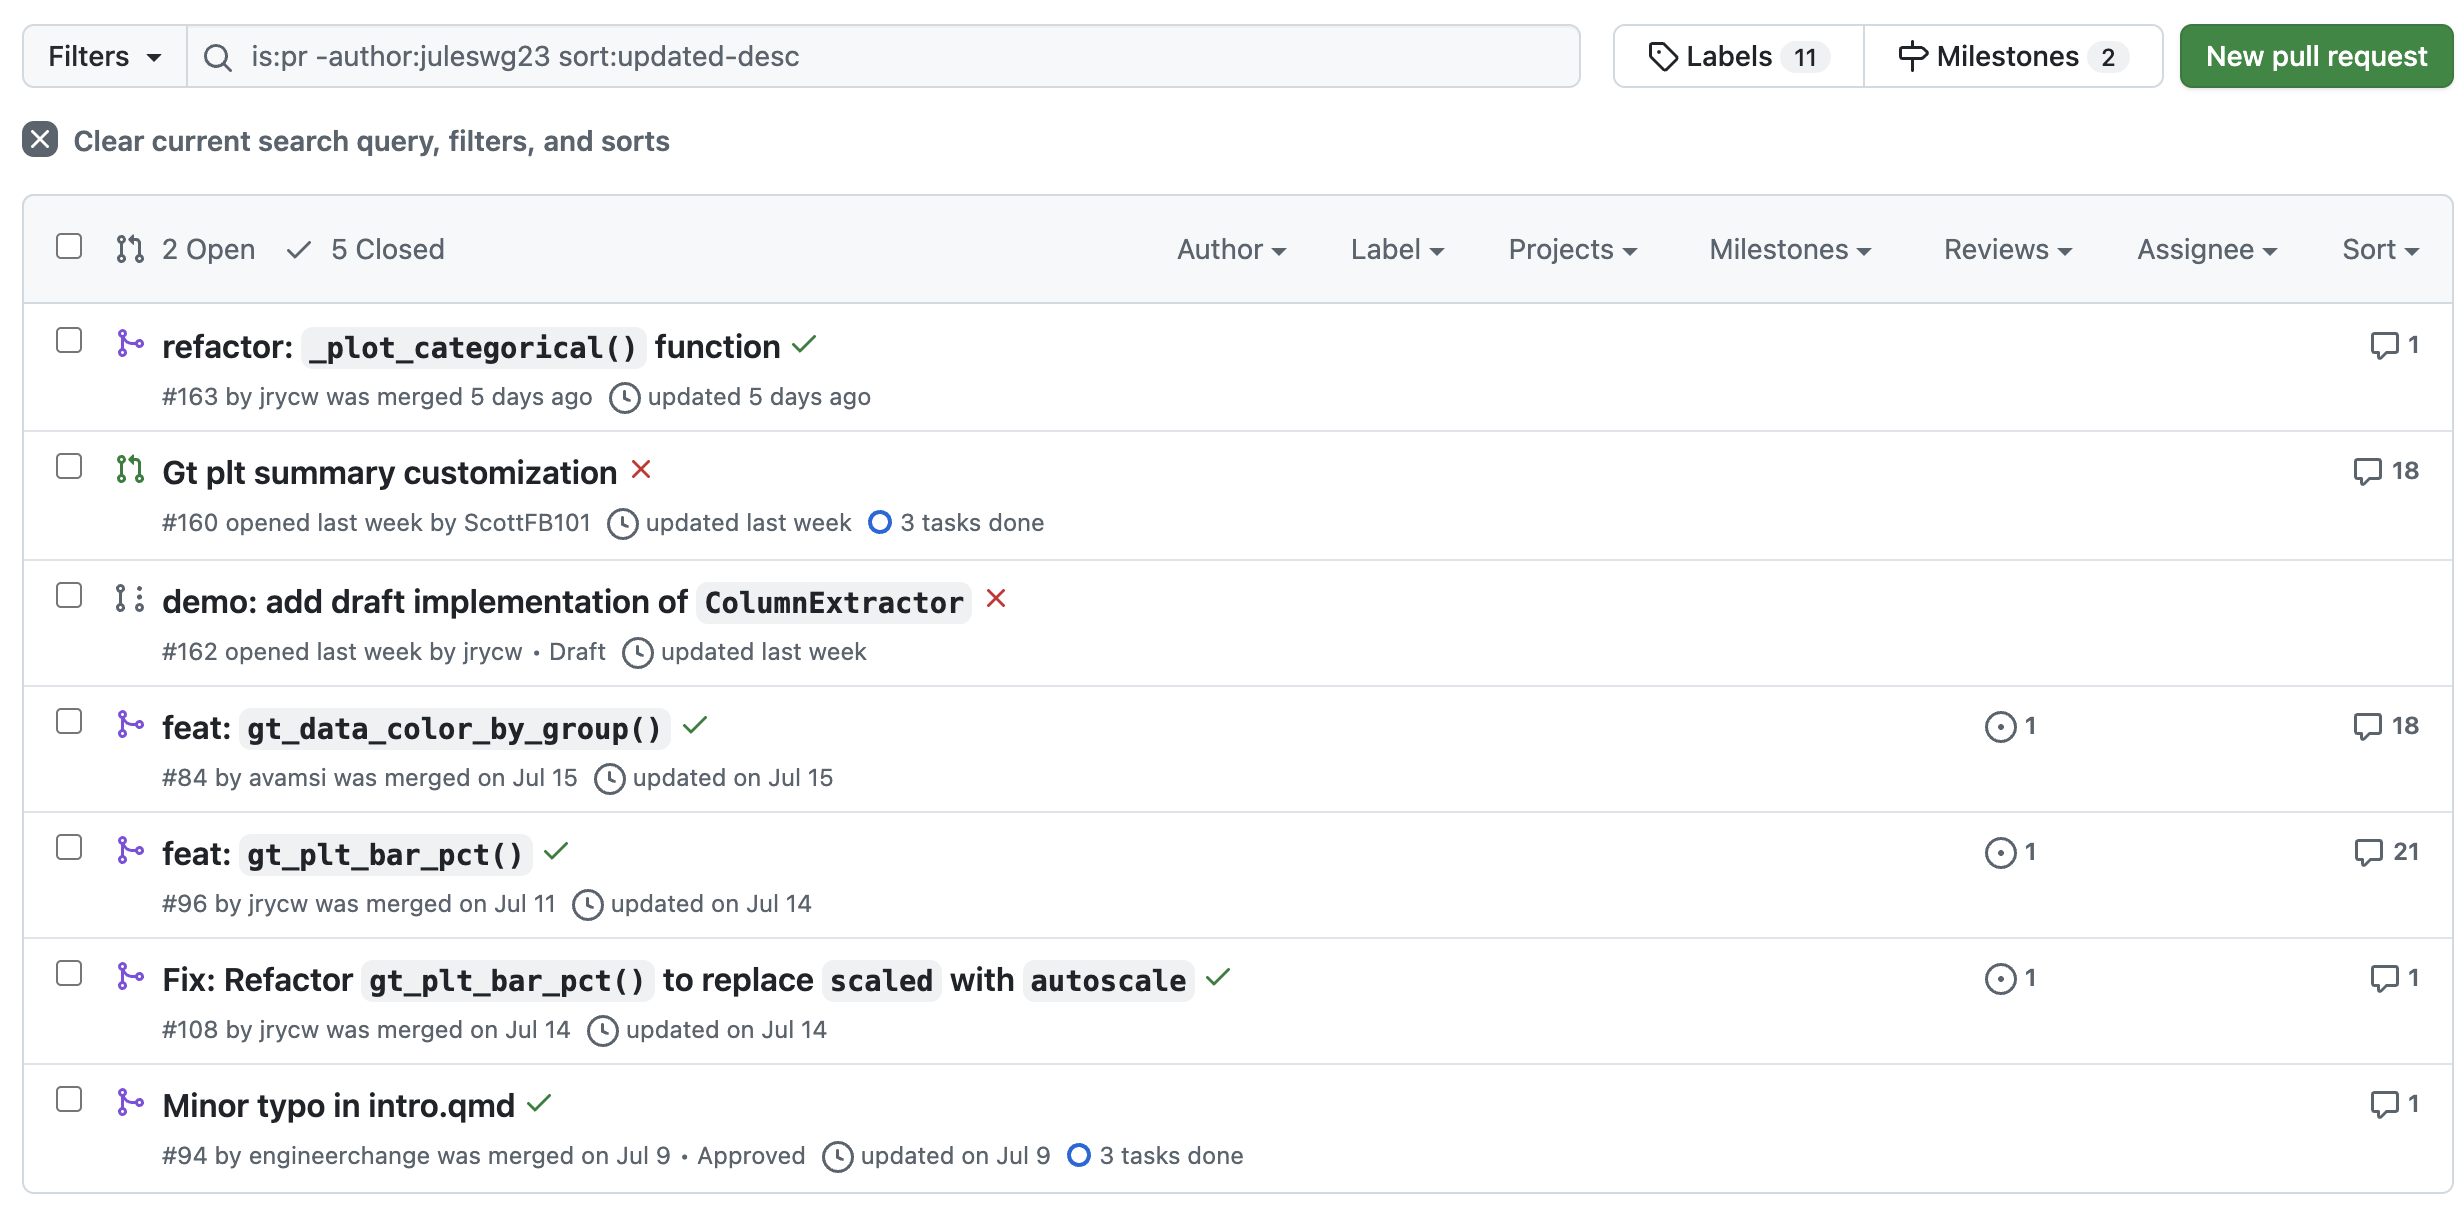
Building Community
Thank you
- Rich and Michael
- The whole tiny-tools squad (Andrew, Hassan, Jeroen)
- Another open source intern (Frances)
- Isabel Z, Isabella V, Julia, Libby, Thomas & more who gave me feedback to build on
- All my Donut meet and greeters
![]()